Logic Analyzer - Text Mode
This article introduces the features of the pico-jxgLABO logic analyzer command la. The la command is a console-based tool that can operate independently to display waveforms and analyze communication protocols such as I2C, SPI, and UART.
Features of the la Command
The la command has two main features: data sampling and waveform display/analysis. Data sampling captures signal data into buffer memory, and waveform display or protocol analysis is performed by referencing this buffer memory.
flowchart
       direction LR
       subgraph la[la command]
              direction LR
              data-sampling([Data Sampling]) --> memory[Buffer Memory]
              memory --> pulseview([PulseView Display])
              memory --> textmode([Text Mode Display])
              memory --> analysis([Protocol Analysis])
       end
Once data sampling is performed, the buffer memory contents are retained until the next sampling operation, so you can display or analyze the waveform as many times as you like.
Data Sampling
Starting and Stopping Data Sampling
Specify the GPIO pins to measure with the -p (or --pins) option of the la command, and start sampling with the enable subcommand.
GPIO pins are specified as comma-separated pin numbers. You can also specify ranges using hyphens. Examples:
| GPIO Pin Option | Description |
|---|---|
-p 0 |
Specifies GPIO0 |
-p 2,3,8,9 |
Specifies GPIO2, 3, 8, 9 |
-p 8-15 |
Specifies GPIO8 to GPIO15 |
-p 2-4,8-13 |
Specifies GPIO2 to 4 and GPIO8 to 13 |
The GPIO pins specified here are reflected in the print subcommand and in PulseView waveform display.
After allocating buffer memory for data storage, the la command instructs PIO (Programmable Input/Output) and DMA (Direct Memory Access) to start sampling and then immediately exits. The actual processing is performed by PIO and DMA, so CPU load is almost zero. When the buffer memory is full, sampling stops automatically.
Running the disable subcommand with the la command stops data sampling and releases PIO, DMA, and buffer memory resources. Normally, you do not need to explicitly run the disable subcommand.
Running the enable subcommand again reinitializes resources and starts data sampling. The previous settings for GPIO pins and other sampling parameters are retained, so if there are no changes, just run enable.
Integration with PulseView
When you press the Start button in PulseView, it performs the equivalent of the la enable command on the Pico board. You must set the GPIO pins and other sampling options with the la command beforehand.
When sampling starts, pico-jxgLABO polls the buffer memory status and sends sampling data to PulseView when available. Pressing the Stop button stops sending this data. Even after data transfer is complete, the buffer memory contents remain, so you can display waveform data or perform protocol analysis with the print subcommand of the la command.
About Sampling Mode
The logic analyzer in pico-jxgLABO performs sampling in transitional mode. In transitional mode, data is sampled only when the signal changes, making efficient use of buffer memory. The same sampling rate can be used for both fast (high-frequency) and slow (low-frequency) signals.
Selecting Internal or External Signals
You can specify the sampling target with the --target option. If you specify internal (default), internal Pico signals are sampled; if you specify external, external signals input to GPIO pins are sampled.
--target:internalsamples internal Pico signals--target:externalsamples external signals on GPIO pins
The --target option sets all GPIO pins at once, but you can change the setting for each GPIO pin using the following options:
--internal:PINSspecifies GPIO pins to sample internal signals--external:PINSspecifies GPIO pins to sample external signals--inherited:PINSspecifies GPIO pins to inherit the--targetoption setting
If the measurement target is external signals, a backquote () is added before the GPIO pin number in the status display when you runla`. Example:
L:/>la -p 2,3 --target:internal
disabled ---- 12.5MHz (samplers:1) pins:2,3 events:0/0 (heap-ratio:0.7)
L:/>la -p 2,3 --target:external
disabled ---- 12.5MHz (samplers:1) pins:`2,`3 events:0/0 (heap-ratio:0.7)
Specifying the Sampling Rate
pico-jxgLABO uses the PIO state machine for sampling. Here, the state machine used for sampling is called a sampler.
It takes 12 clock cycles for a sampler to sample one data point. For Pico2 (150MHz clock), 150MHz ÷ 12 = 12.5MHz sampling is possible. For Pico (125MHz clock), 125MHz ÷ 12 = 10.4MHz sampling is possible.
Each PIO block on the Pico board has 4 state machines (samplers). By running these in parallel with staggered start times, you can increase the sampling rate. Specify the number of samplers with the --samplers option. Examples:
| Option | Pico2 | Pico |
|---|---|---|
--samplers:1 |
12.5MHz | 10.4MHz |
--samplers:2 |
25.0MHz | 20.8MHz |
--samplers:3 |
37.5MHz | 31.2MHz |
--samplers:4 |
50.0MHz | 41.7MHz |
Increasing the number of samplers increases the sampling rate but decreases the number of events that can be sampled.
Specifying the PIO Block to Use
Pico2 has three blocks: PIO0, PIO1, and PIO2; Pico has two: PIO0 and PIO1. By default, PIO2 (Pico2) or PIO1 (Pico) is used for the logic analyzer, but you can specify the PIO block to use with the --pio option. Examples:
--pio:0uses PIO0--pio:1uses PIO1--pio:2uses PIO2
Specifying Buffer Memory Size
The --heap-ratio:N option (N is a value between 0 and 1) specifies the proportion of the heap area to use as buffer memory. The default is 0.7, using 70% of the heap as buffer memory. If you get a memory allocation error when running la enable, reduce this value.
Waveform Display
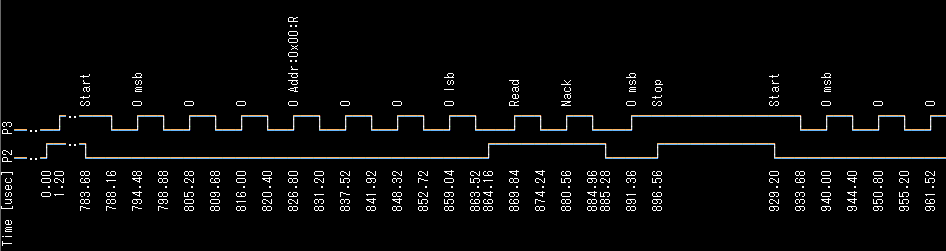
You can display the sampled waveform data in text format using the print subcommand of the la command. Here, we capture I2C interface signals as an example.
First, start capturing with GPIO2 (I2C SDA) and GPIO3 (I2C SCL) as measurement targets.
Next, use the i2c1 command to output I2C protocol signals. Use the -p option to specify the SDA and SCL pins. The scan subcommand sends Read requests to addresses 0 to 127 and displays the addresses that respond.
L:/>i2c1 -p 2,3 scan
Bus Scan on I2C1
   0  1  2  3  4  5  6  7  8  9  A  B  C  D  E  F
00 -- -- -- -- -- -- -- -- -- -- -- -- -- -- -- --
10 -- -- -- -- -- -- -- -- -- -- -- -- -- -- -- --
20 -- -- -- -- -- -- -- -- -- -- -- -- -- -- -- --
30 -- -- -- -- -- -- -- -- -- -- -- -- -- -- -- --
40 -- -- -- -- -- -- -- -- -- -- -- -- -- -- -- --
50 -- -- -- -- -- -- -- -- -- -- -- -- -- -- -- --
60 -- -- -- -- -- -- -- -- -- -- -- -- -- -- -- --
70 -- -- -- -- -- -- -- -- -- -- -- -- -- -- -- --
Now the I2C signal is generated. To check if it was captured, run the la command to check the logic analyzer status.
The number of events increases, indicating that the signal was captured. Use the la print command to display the captured signal.
The following is a screenshot of the terminal software rotated 90 degrees.
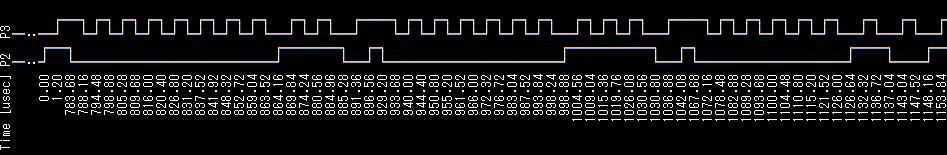
The display resolution (time interval per line) is 1000usec (1msec) by default. In the example above, the edge interval is about 5usec, so you need to set a shorter interval for correct display. Use the --reso option to set the display resolution to 4usec and display the waveform.
By default, la print displays the first 80 events in buffer memory. Use the --part option to specify the range of events to display.
--part:head: Displays the first events (default)--part:tail: Displays the last events--part:all: Displays all events
To change the number of events displayed for head or tail, use the --events:N option (N is the number of events).
With the --part:all option, you can display all events. Press Ctrl-C to interrupt the display.
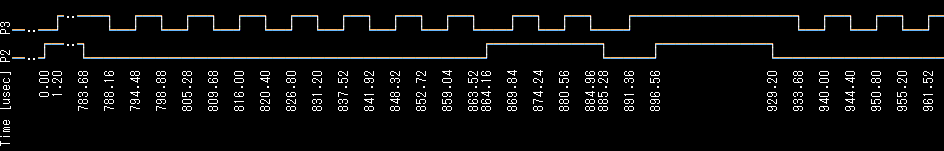
L:/>la print --part:all
 Time [usec] P2  P3
             │   │
             :   :
        0.00 └─┐ │
        1.28   │ └─┐
               :   :
      776.00 ┌─┘   │
             │     │
      780.40 │   ┌─┘
             │   │
      786.72 │   └─┐
             │     │
             :
             :
You can save the display output to a file using redirection. For example, to save to a file named i2c.log:
Waveform display uses Unicode multibyte characters, but these may not display correctly in some environments. In that case, specify an option such as --style:ascii2 to display using only ASCII characters.
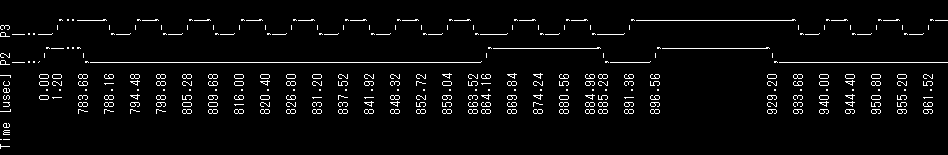
The --style option allows you to specify the character set and waveform size. The default is unicode2.
unicode1,unicode2,unicode3,unicode4... use Unicode multibyte charactersascii1,ascii2,ascii3,ascii4... use ASCII characters
Communication Protocol Analysis
You can analyze communication protocols such as I2C, SPI, and UART using the dec subcommand. The format is dec:DECODER {SUB-COMMANDS...}. DECODER is the protocol decoder name such as i2c, spi, or uart. The SUB-COMMANDS in braces are subcommands specific to each decoder.
I2C Protocol Analysis
To decode the I2C protocol, specify i2c as the protocol name for the dec subcommand and the following subcommands:
sda:PIN: Specify the SDA pinscl:PIN: Specify the SCL pin
Capture the signal when sending Read requests to addresses 0 to 127 using the i2c1 scan command, and decode it with the la dec:i2c command.
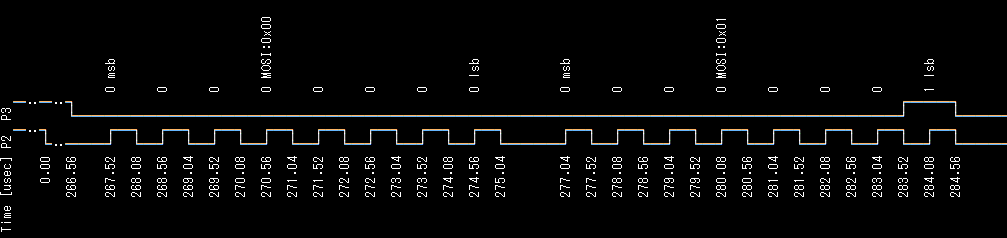
SPI Protocol Analysis
To decode the SPI protocol, specify spi as the protocol name for the dec subcommand and the following subcommands:
mode:MODE: Specify the SPI mode (0-3)mosi:PIN: Specify the MOSI pinmiso:PIN: Specify the MISO pinsck:PIN: Specify the SCK pin
You must specify at least one of mosi or miso.
Capture the signal when sending data from 0 to 255 on SPI MOSI using the spi0 write command, and decode it with the la dec:spi command.
L:/>la -p 2,3 enable
L:/>spi0 -p 2,3 write:0-255
L:/>la dec:spi {mode:0 sck:2 mosi:3} print --reso:0.4
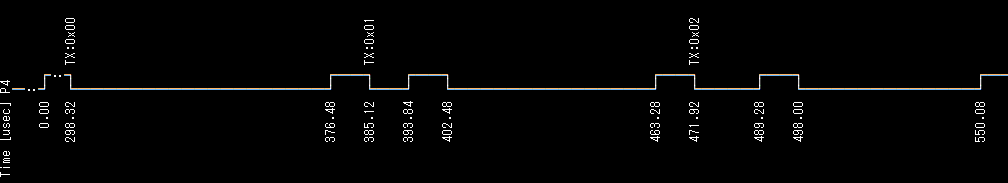
UART Protocol Analysis
To decode the UART protocol, specify uart as the protocol name for the dec subcommand and the following subcommands:
tx:PIN: Specify the TX pinrx:PIN: Specify the RX pinbaudrate:RATE: Specify the baud rate in bps (default: 115200)frame:NPS: Specify the frame format.Nis the data bit length (5, 6, 7, 8, 9), P is parity (n:none, e:even, o:odd), S is stop bit length (1, 2). Default is8n1(8bit, none, 1bit stop)
baudrate and frame are optional. You must specify at least one of tx or rx.
Capture the signal when sending data from 0 to 255 on UART TX using the uart1 write command, and decode it with the la dec:uart command.